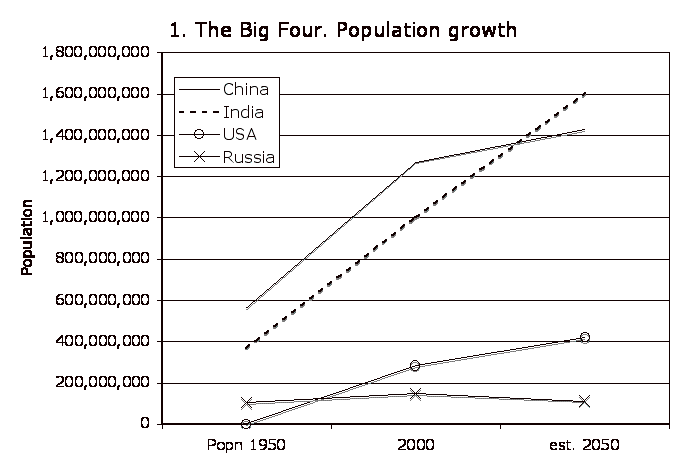
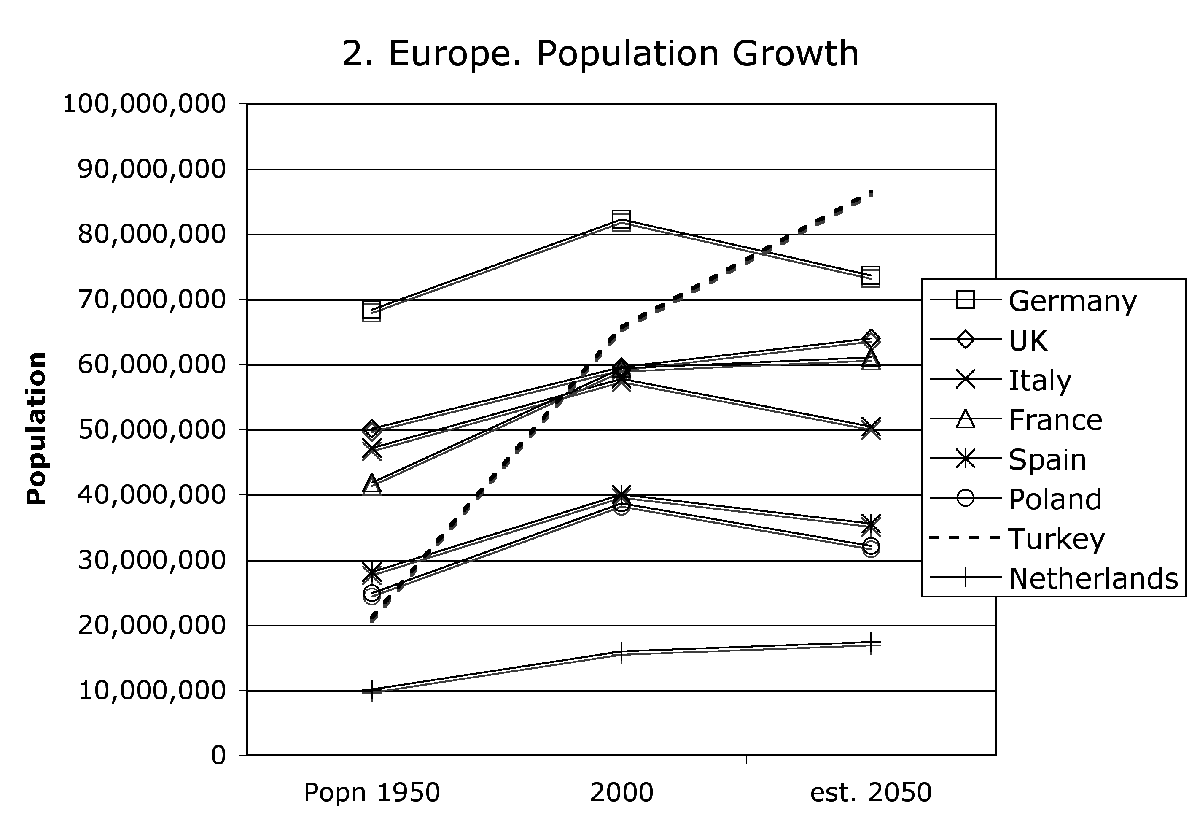
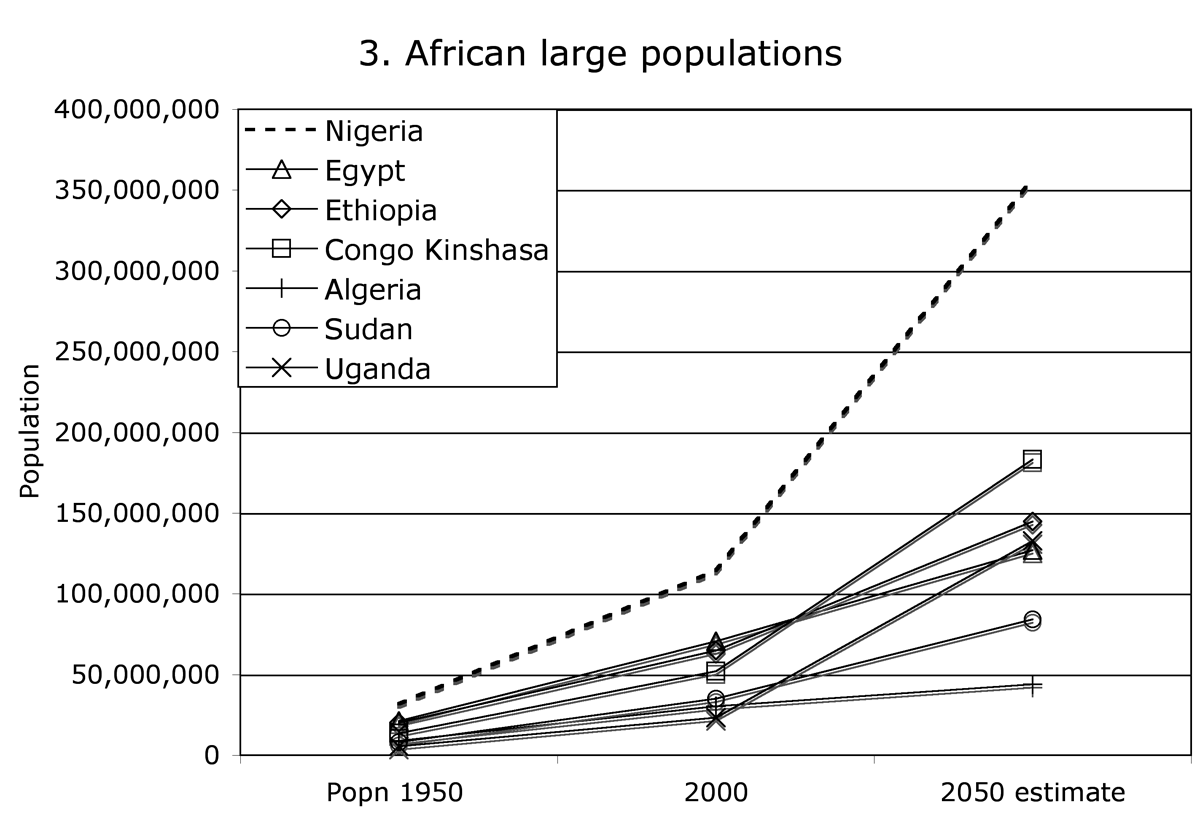
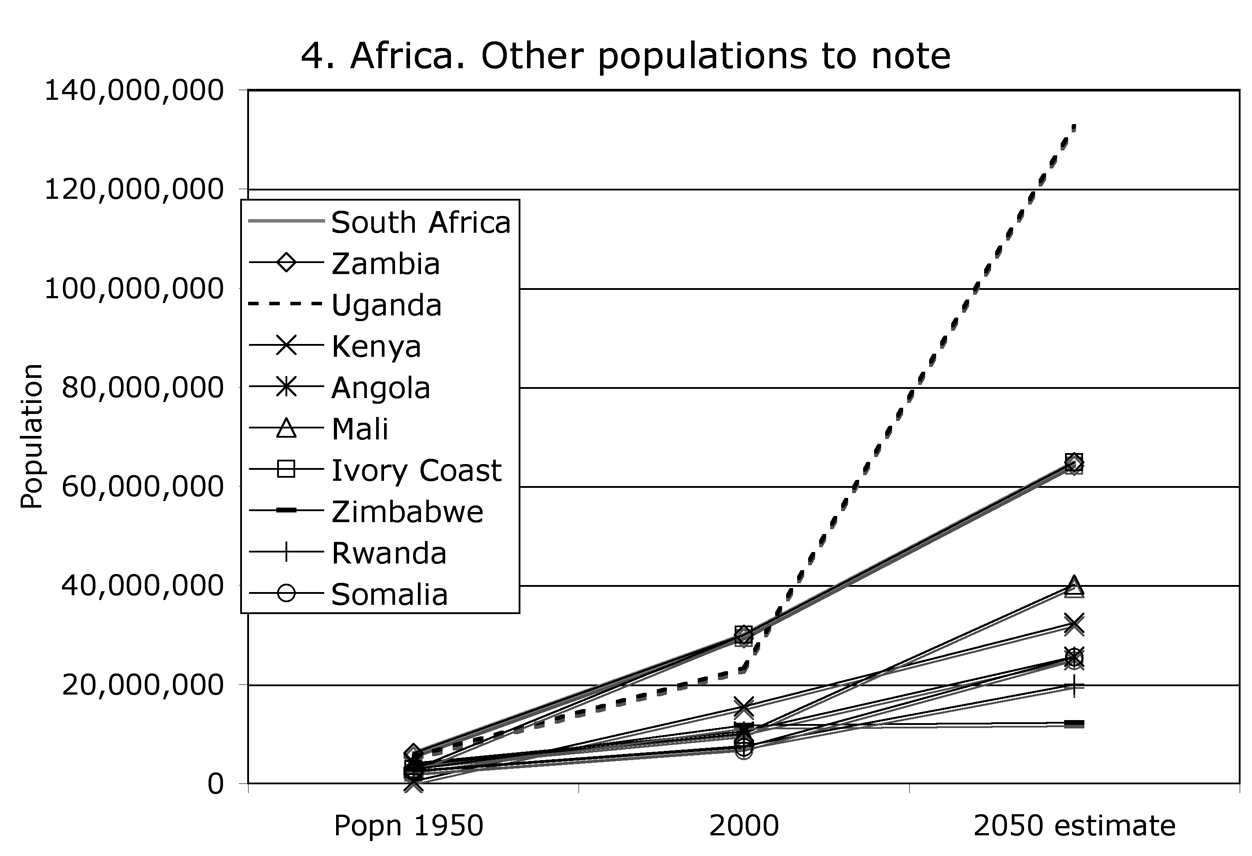
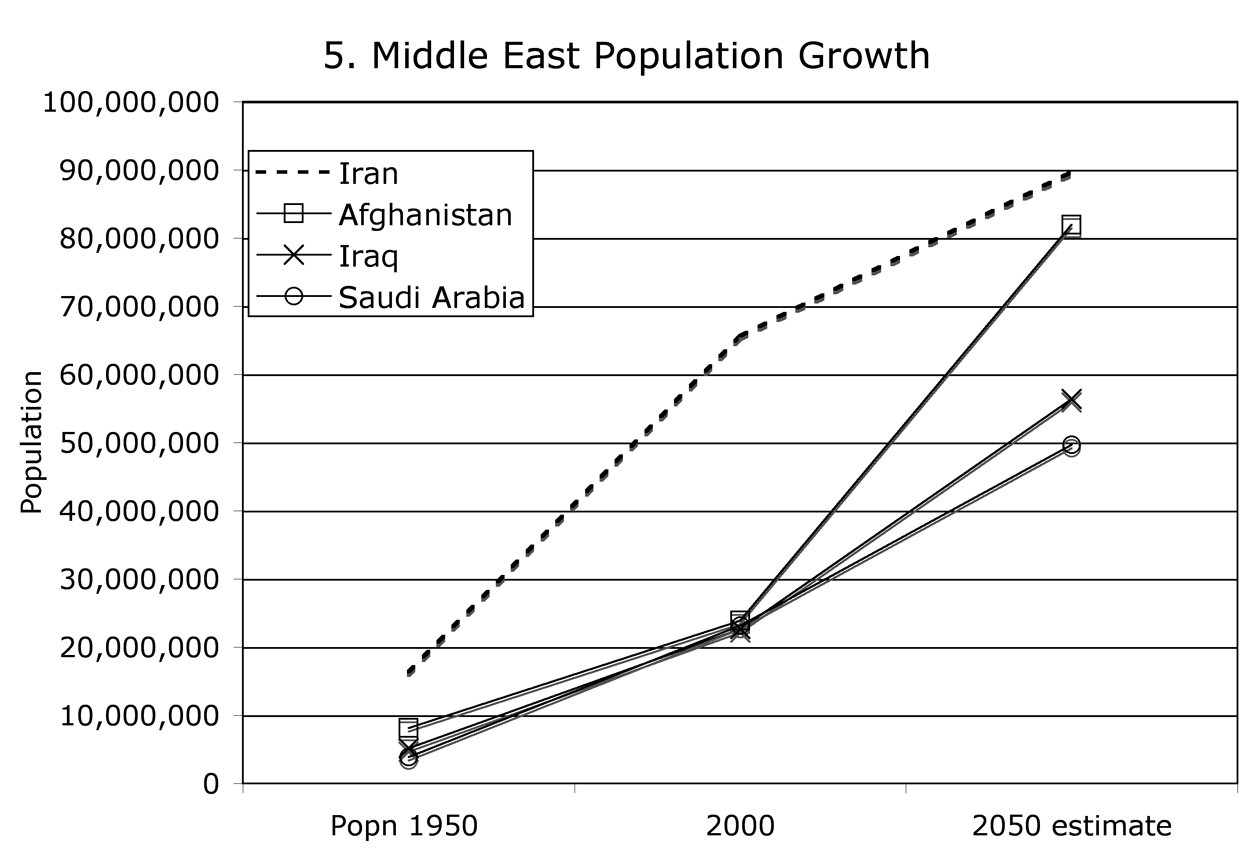
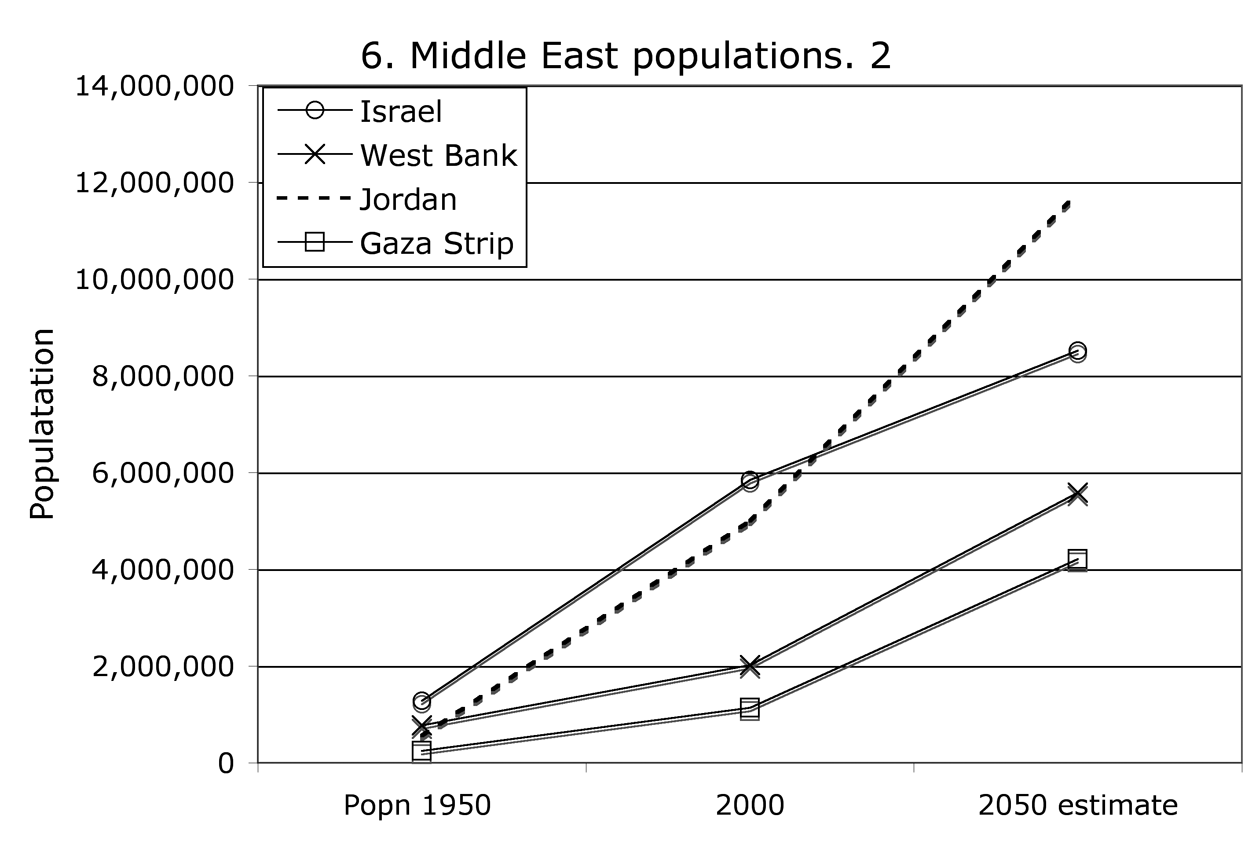
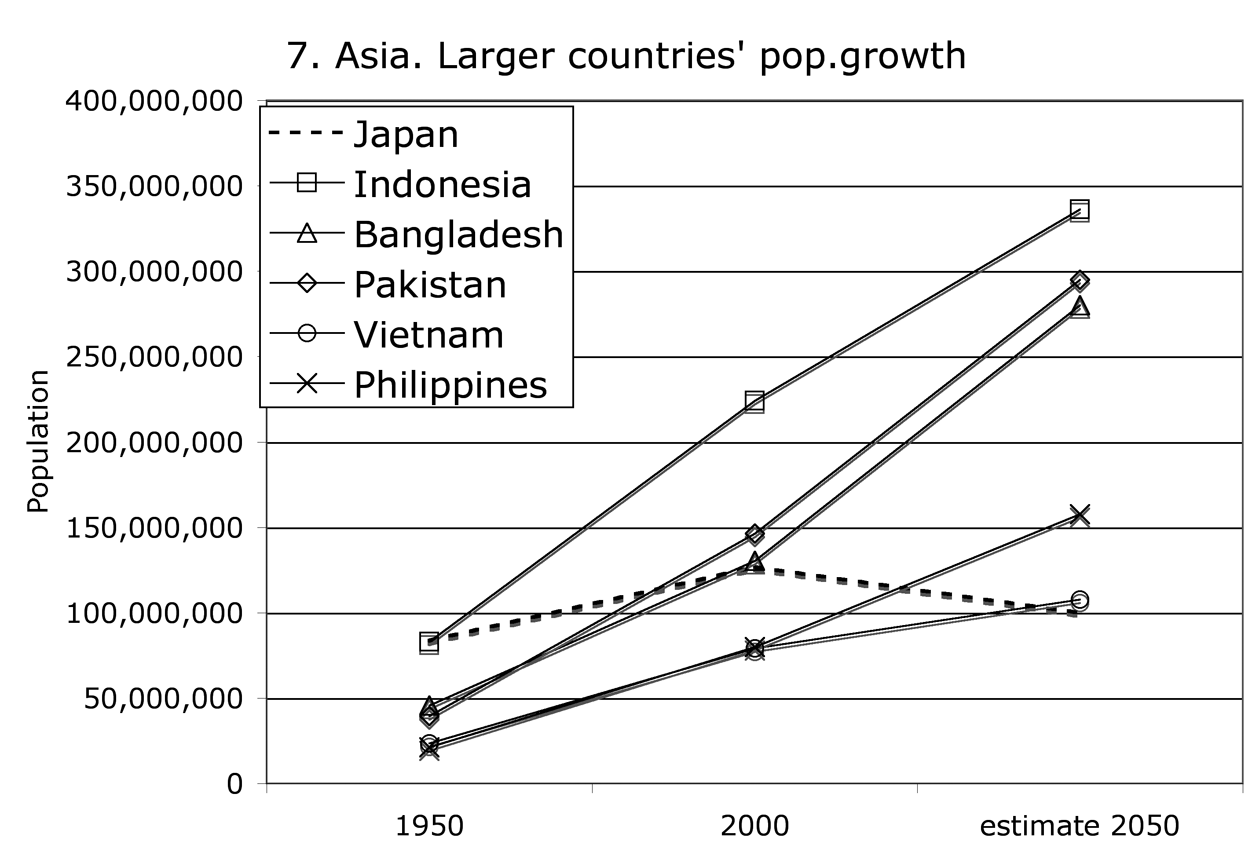
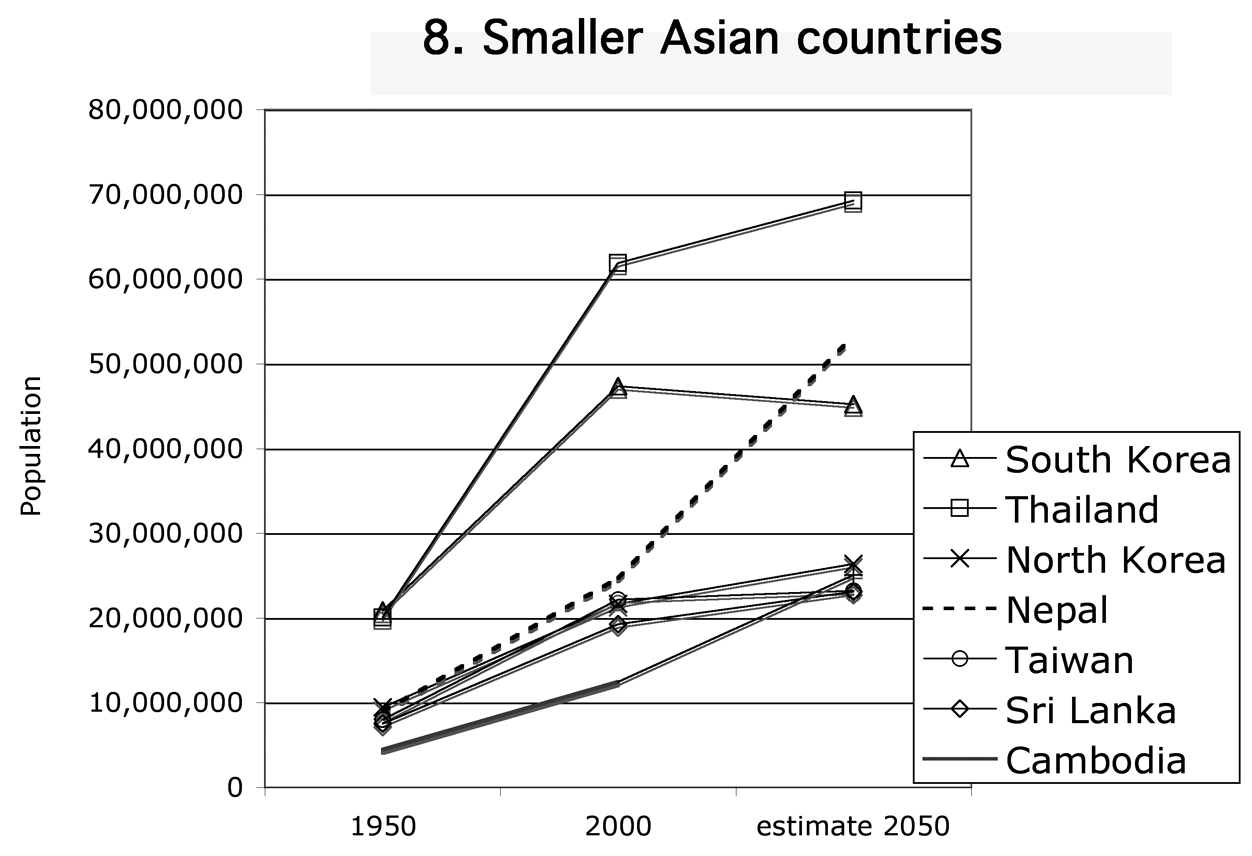
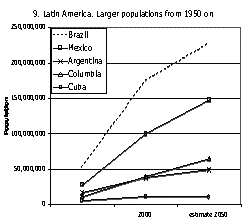
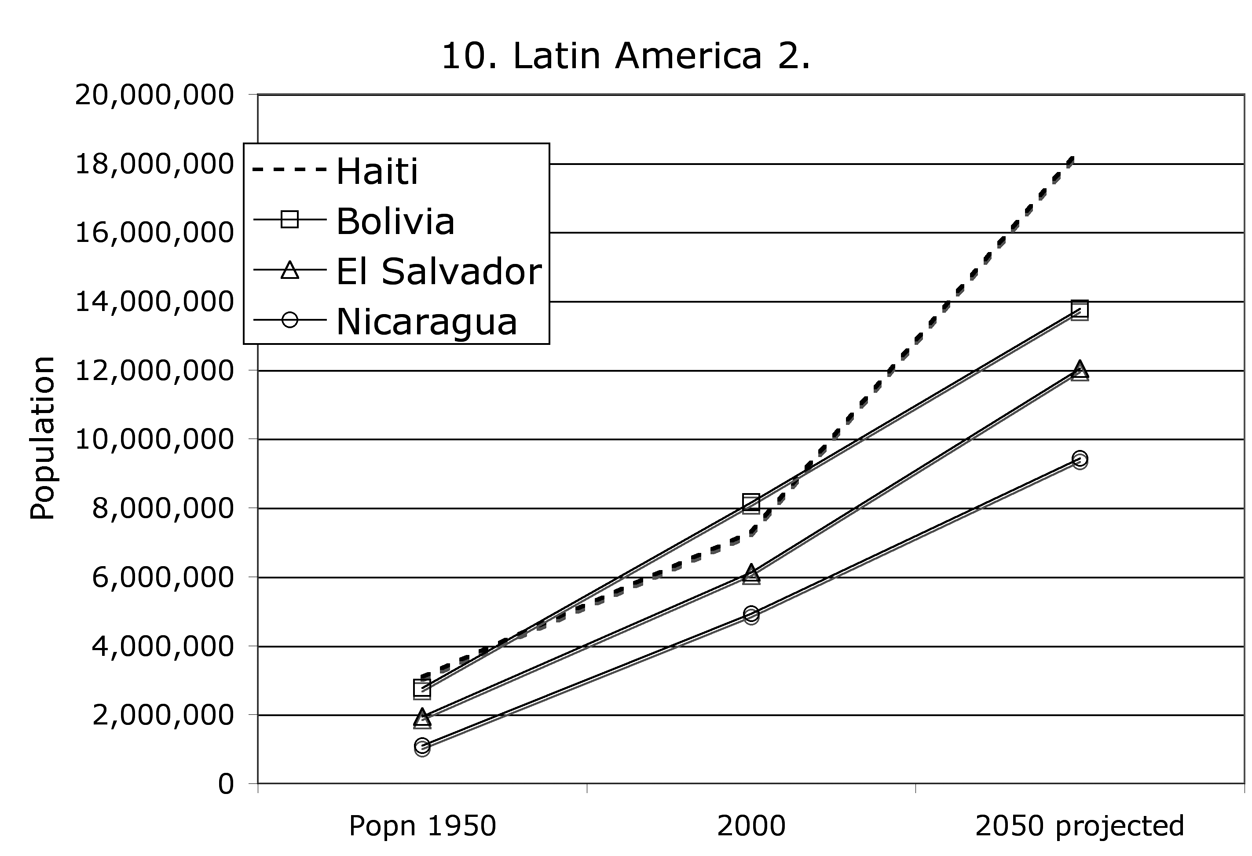
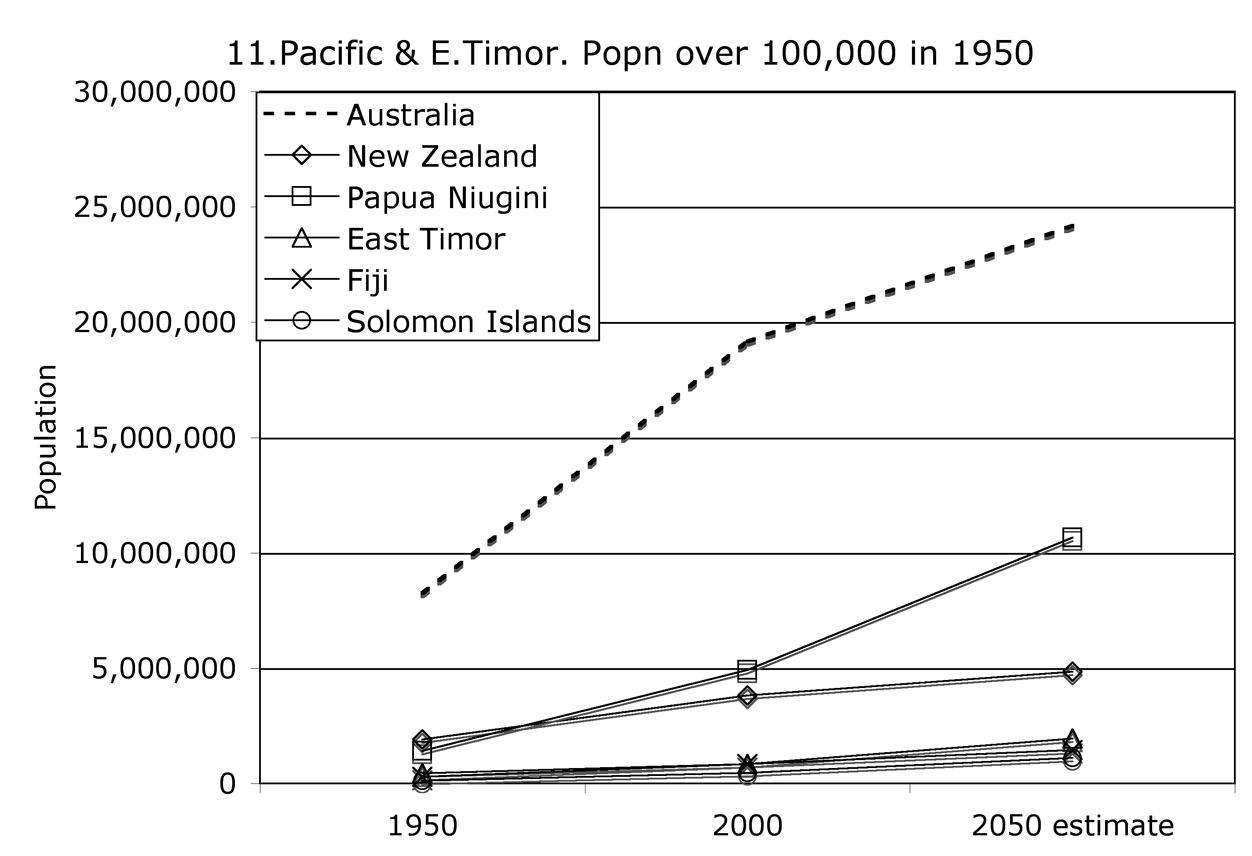
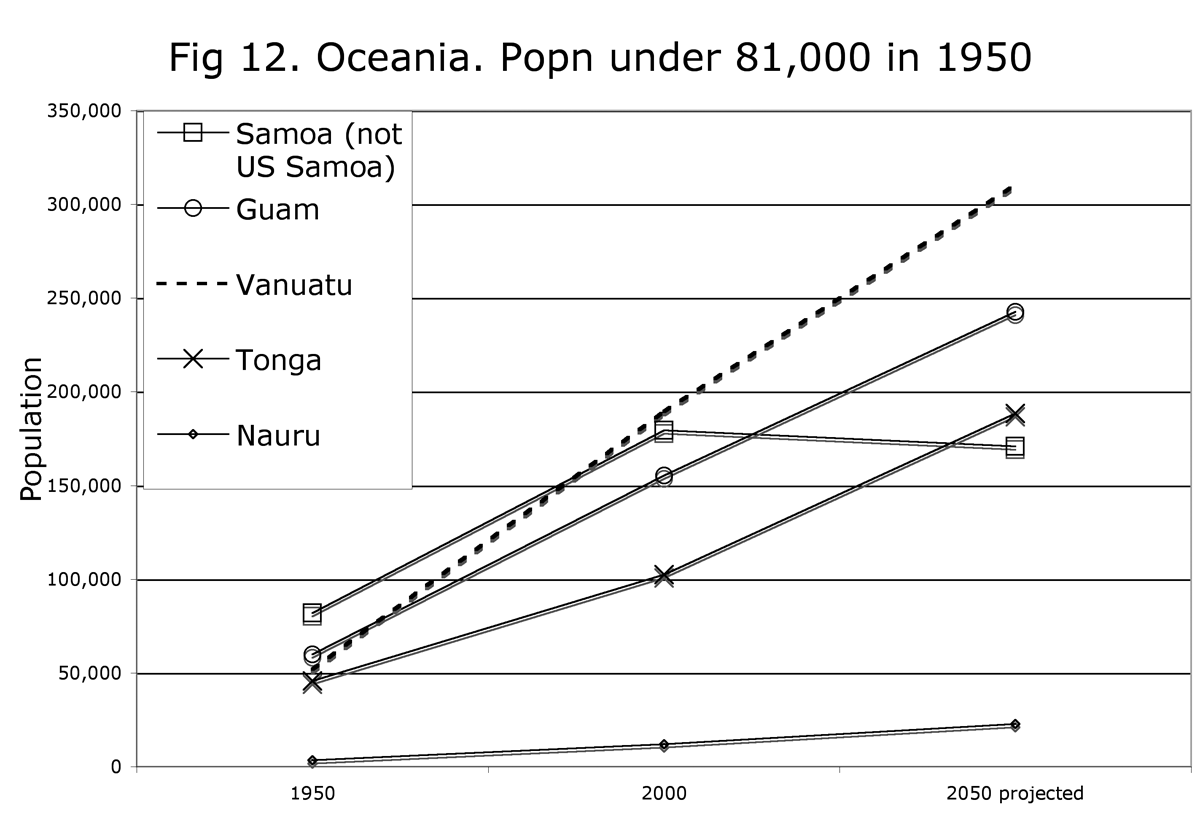
GRAPHS of WORLD POPULATION GROWTH OVER ONE HUNDRED YEARS1950 to 2000 to 2050World population tables show the figures for countries, in millionsGraphs are set out in population figures of millions. They are set out in an order to try to show the problems as clearly as possible.
Graph not included here: World population growth from pre-history on. Data compiled from US Census Bureau International Data Base as at April 2005, and William Stanton's The Rapid Growth of Human Populations 1750-2000: Histories, Consequences, Issues, Nation by Nation. William. NI: Multiscience Publishing Company Ltd. 2003. Population growth from earlier times
|
|
|
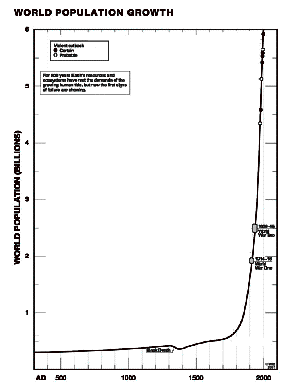
These graphs of world population growth adapted from Stanton (2004) show the exponential growth from around 500 million since the Industrial Revolution.
India illustrates how quickly populations have recovered from frightful disasters (and see Rwanda and Ethiopia).
Examples of World Population Growth in 100 Years
How it will rise from 6 billion now to 9 billion in 2050 unless . . .
Figures from 1950 – 2000, and estimated for 2050 (not even Europe going below 1950)
 |
 |
 |
 |
 |
 |
 |
 |
 |
 |
 |
 |
Relevant web-pages about population and poverty on OzIdeas:
- Concepts, economic
- Jobs, Alternativ jobs for the future
- Preventing poverty
- Notes on population growth
- Further notes on population growth as a coming tsunami
- Population
- World population growth - graphs (and see PDF)
- World population growth - tables (and see PDF)
- Population crises and cycles throughout history. An important book by Claire and W M S Russell.
- An ageing population is not disastrous
- The US Census Bureau International Database of population and population growth

